

Most personal sites either ship no analytics, hand everything to Google, or stop at a simple pageview counter. I wanted something in the middle: private by default, cheap enough to run on a hobby budget, and rich enough to answer real UX questions like:
- which pages pull people in
- where they go next
- what they read deeply
- what devices and geographies actually matter
This post is the architecture walk-through, but it is also the performance story. The hardest part was not collecting events. It was making the system stay fast and affordable on Upstash Redis' 500K monthly request budget.
TL;DR
- Frontend: client-side buffer batches pageviews, clicks, and scroll milestones instead of sending one request per interaction.
- Write path: Next.js API route enriches events with geo, device, referrer, and company data, then pipelines aggregated counters into Redis.
- Storage: Redis handles hot counters, HyperLogLog uniques, rolling event logs, and historical flow hashes.
- Read path: the private dashboard now reads from a precomputed Redis snapshot instead of reconstructing every view from scratch.
- Result: the system stays private, expressive, and significantly cheaper to operate.
Architecture Overview
The system is intentionally split into two modes:
- Hot path for capturing traffic cheaply
- Cold-ish path for turning that traffic into a dashboard
graph TD
    User([User Visit]) --> Buffer[Client-side Event Buffer]
    Buffer --> Edge[Next.js API /api/track - Batched]
    Edge --> Aggregator[Server-side Aggregator]
    Aggregator --> Redis{Upstash Redis}

    subgraph "Data Structures"
    Redis --> Events[List: visits:events - Rolling Buffer]
    Redis --> HLL[HyperLogLog: unique:visits - Cardinality]
    Redis --> Daily[Hash: visits:daily:date - Aggregates]
    end

    Dashboard[Next.js Dashboard] --> Redis
What The System Actually Stores
Instead of treating Redis like a generic dump for raw logs, I use a few intentionally different structures:
| Data Type | Redis Structure | Why |
|---|---|---|
| Raw recent events | LIST |
Keep a rolling activity buffer for recent drilldown and lightweight backfills |
| Unique visitors | HyperLogLog |
Constant memory footprint instead of growing sets |
| Top pages / countries / devices | simple counters | Cheap hot-path increments |
| Daily breakdowns | per-day keys and hashes | Fast time-series charts without a warehouse |
| Historical page flow | Redis hashes | Persistent path graph for the journey explorer |
| Snapshot for dashboard | single JSON blob | Cheap reads for the dashboard route |
Architecture Decision Record
These were the choices that mattered most:
| Feature | Choice | Rationale |
|---|---|---|
| Hot Path Storage | Redis | Required sub-millisecond writes for tracking and low-latency reads for the dashboard. |
| Counting Unique IDs | HyperLogLog | Traditional sets grow linearly with traffic; HLL maintains a constant 12KB footprint. |
| Data Retention | Rolling Buffer | Storing every raw event indefinitely is cost-prohibitive. A fixed-size List preserves recent context. |
| Privacy | Salted Hashing | Ensures PII (IP addresses) is never stored, making the system GDPR-compliant by design. |
| Write Strategy | Buffer & Flush | Batched events from the client (10s intervals) to minimize Redis request counts and avoid rate limits. |
| List Trimming | Daily Cron | Running LTRIM per request wastes 2 commands per batch. A Vercel Cron job trims the event list once per day instead. |
| Dashboard Read Strategy | Snapshot + Recent Overlay | Expensive summary work runs on cron; dashboard reads stay cheap while the recent event log remains live. |
Performance Snapshot
This is the part that made the architecture worth keeping.
The Budget Constraint
Upstash gives me 500K requests per month on the free tier. At one point the project had already consumed 416K / 500K requests, which is 83.2% of the budget, and the month was not over.
That forced a clear question:
is this architecture elegant, or is it just expensive?
What Changed
| Upgrade | Before | After | Why It Matters |
|---|---|---|---|
| Client-side buffering | More frequent event writes | batched flushes every ~10s | Cut write amplification dramatically |
| Session dedup writes | 2 live SET NX round-trips |
warm in-memory cache + pipelined fallback | Removed blocking live Redis calls |
| Session activity storage | separate last-page + last-activity writes | single HSET |
Fewer write commands per batch |
| Rolling log trim | LTRIM on every tracking batch |
daily cron | Removed unnecessary hot-path work |
| Analytics read path | rebuild summary on each dashboard load | snapshot read + recent overlay | Turns dashboard into a cheap consumer |
| Recent event scan | LRANGE 0..9999 |
LRANGE 0..2499 |
75% smaller recent-event payload |
| Session enrichment on read | per-session HGETALL fan-out |
removed | Eliminated read cost that scaled with recent session count |
The Numbers Behind It
- Monthly command pressure before write-path cleanup:
416K / 500K - Estimated monthly savings from hot-path fixes: about 50K commands/month
- Estimated post-fix command level: about 360K / 500K
- Recent event fetch reduction:
10,000 -> 2,500entries - Payload reduction for recent event scan: 75%
- Typical dashboard read before snapshot path:
12broadKEYSscans1largeLRANGE2PFCOUNTs- many
GETs for counters NextraHGETALLs for recent sessions
- Typical dashboard read after snapshot path:
1GETfor the dashboard snapshot1LRANGEfor the recent event log- plus an in-memory cache hit inside the server process when warm
That last point is the biggest structural change. The dashboard used to be a data assembler. Now it is mostly a data reader.
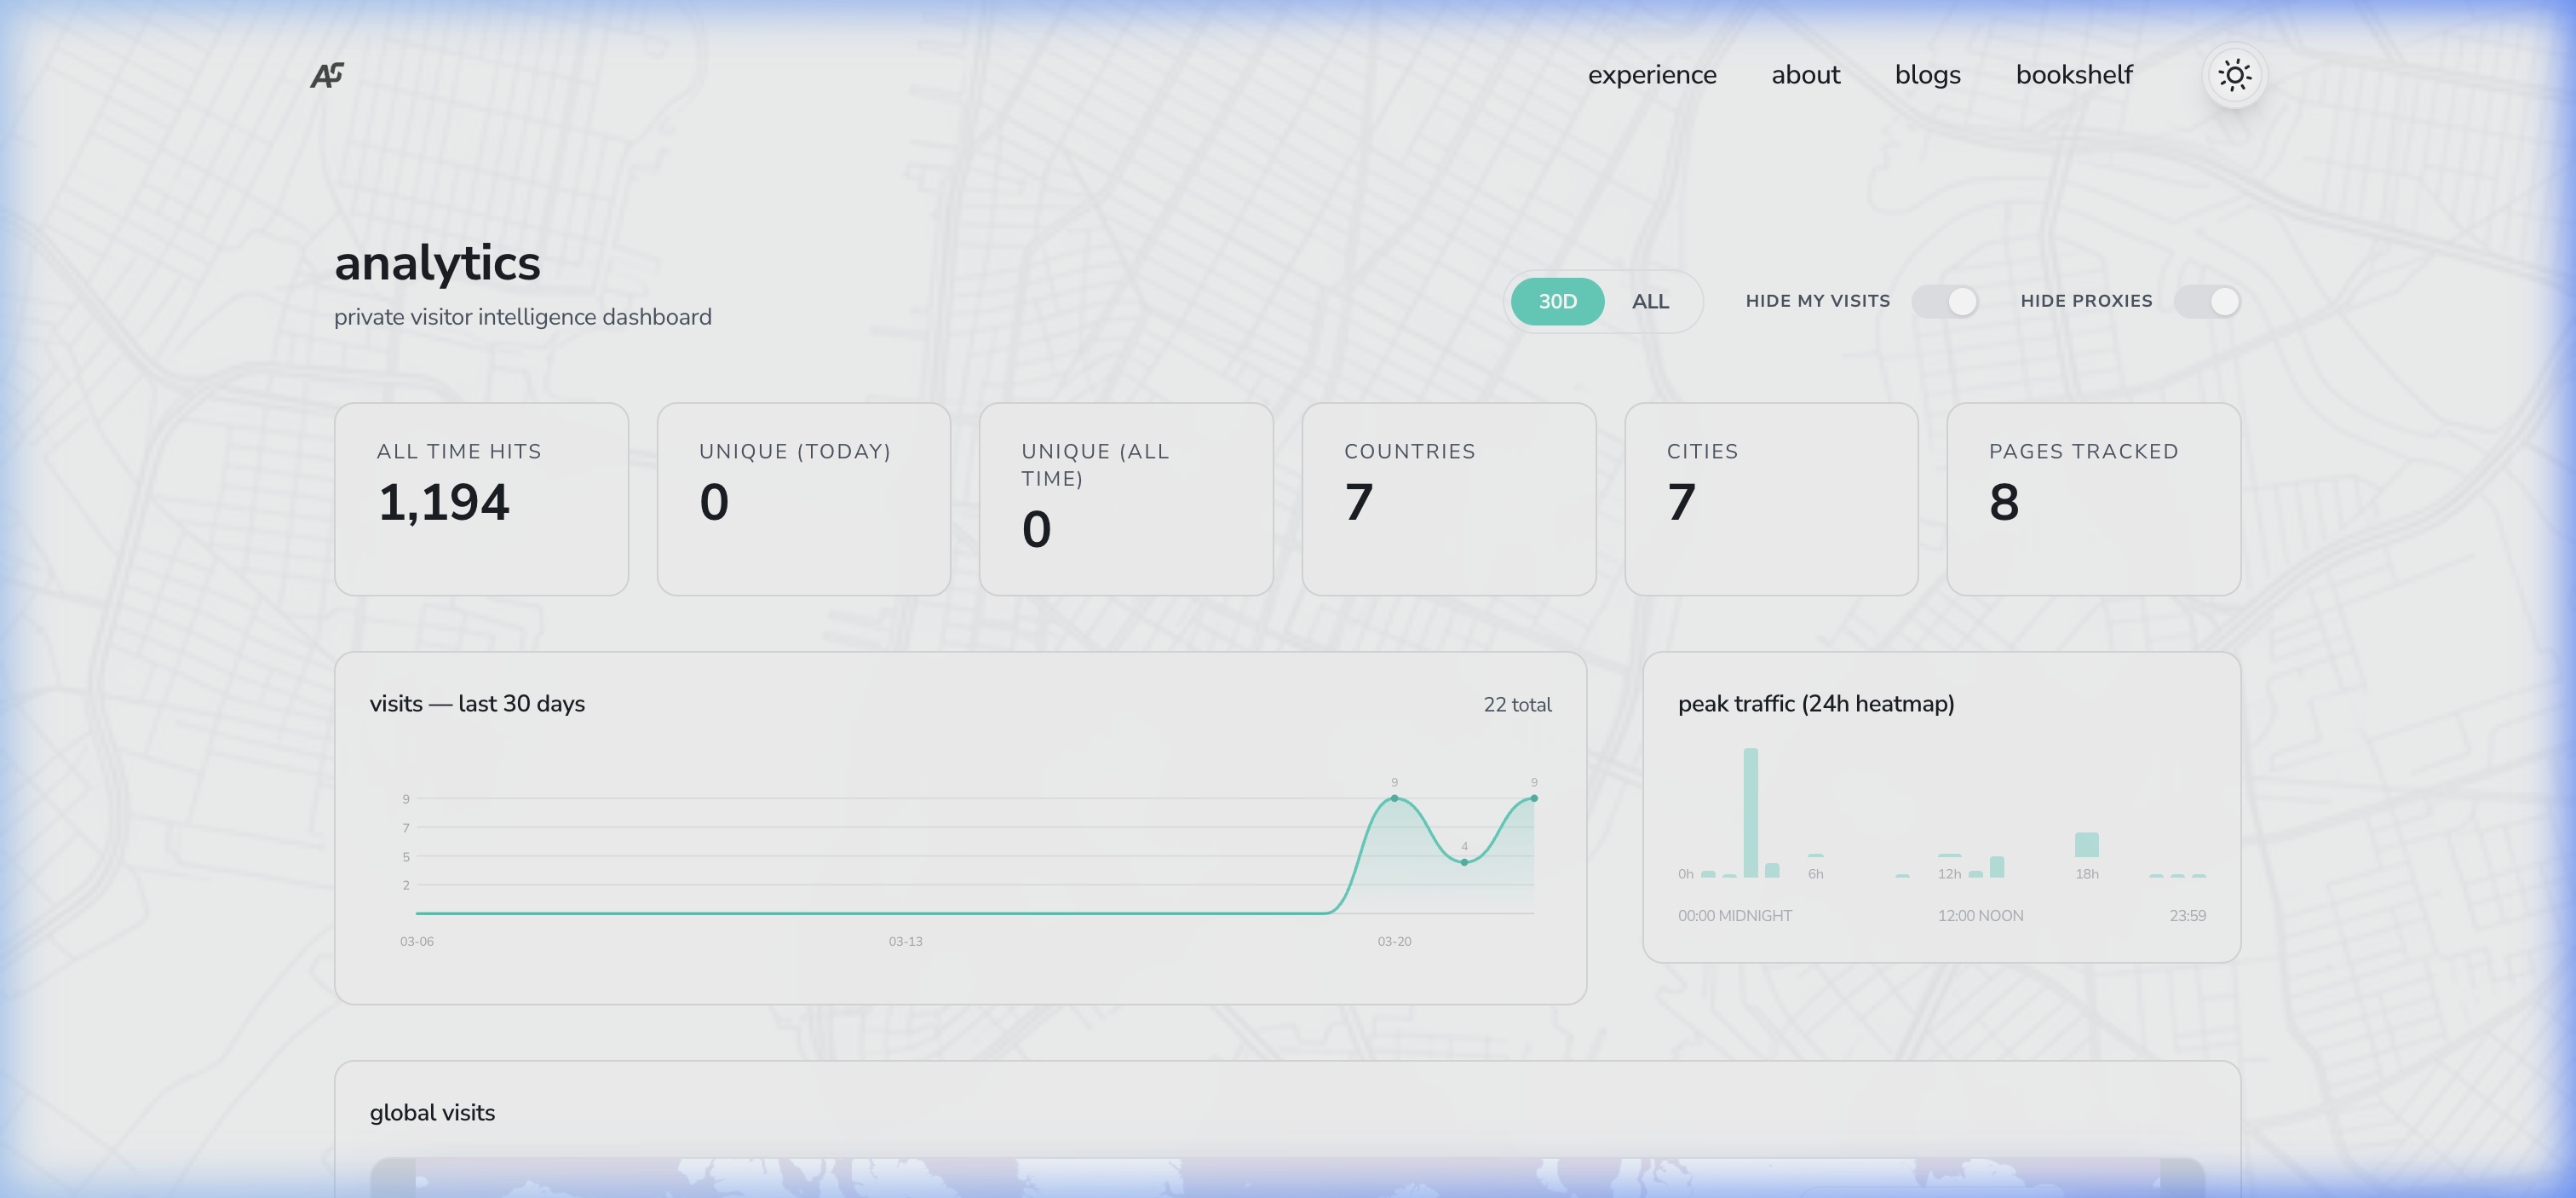
What The User Experience Looks Like
The real dashboard is private, but here is a simplified HTML mock that mirrors the pieces I actually care about: high-level counts, time series, path flow, geography, and behavior.
The point of the UI is not to be flashy. It is to answer a few concrete questions quickly:
- where visitors come from
- what pages actually matter
- how they move through the site
- where they drop
- what devices and geographies shape the experience
Technical Challenges & Evolutions
Building this system from scratch revealed several non-obvious hurdles that required significant architectural pivots:
-
The "Request Price" Challenge:
- Problem: Each visitor interaction (scroll, click, pageview) originally triggered individual Redis commands. In a serverless/Upstash environment, this consumed the free tier quota rapidly.
- Fix: Transitioned to a Client-side Event Buffer. By grouping events and sending them in "micro-batches" every 10 seconds, Redis command volume was reduced by ~80% without losing data fidelity.
-
Type-Conflict & Migration Errors:
- Problem: Moving from standard Sets (for unique visitor IDs) to HyperLogLog caused
WRONGTYPEerrors on existing keys, leading to persistent 500 API failures. - Fix: I cleared the legacy keys and implemented a Log-based Backfill. Since the system maintains a rolling buffer of raw events, I was able to re-process historical traffic and reconstruct the new HLL structures safely.
- Problem: Moving from standard Sets (for unique visitor IDs) to HyperLogLog caused
-
The Pipeline Limit:
- Problem: When fetching data for the dashboard, a single massive Redis Pipeline would sometimes exceed REST API payload limits or timeout.
- Fix: Implemented Chunked Pipeline Execution, splitting large data fetches into smaller batches of 500 commands to ensure stability.
-
The Free-Tier Command Budget (
416K / 500Kper month):- Problem: After adding session tracking, heatmaps, and geo rollups, I hit 83% of Upstash's 500K/month free-tier command limit — and the month wasn't over. The write-to-read ratio was ~5:1, meaning the tracking endpoint was burning commands, not the dashboard reads. Profiling the pipeline revealed four culprits:
- Two out-of-pipeline
await redis.set(...{nx:true})calls per request (live round-trips that blocked the pipeline from batching them). - Two separate
SETcommands per event forlast_pageandlast_activity. - Three separate commands per request for visitor hash updates (
HSET,HSETNX,EXPIRE). - An
LTRIMon thevisits:eventslist fired on every single tracking batch.
- Two out-of-pipeline
- Fix — In-memory session dedup: Replaced the two live
awaitedSET NXcalls with a module-levelMapcache. Warm Lambda instances reuse the cache; cold starts fall back to a pipelinedSET NXthat is batched with all other writes. Net saving: ~2 commands per request. - Fix — HSET collapse: Merged
SET last_page+SET last_activityinto a singleHSETon the existing session hash. Net saving: ~1 command per event in each batch. - Fix — Visitor hash merge: Collapsed visitor bookkeeping so the hot path stopped paying for redundant state updates.
- Fix — Cron-based LTRIM: Moved
LTRIM visits:eventsfrom the hot path to a Vercel Cron job that fires once daily at 3am UTC. Net saving: ~1 command per batch. - Total estimated saving: ~50K commands/month, bringing the budget back to a comfortable ~360K.
- Problem: After adding session tracking, heatmaps, and geo rollups, I hit 83% of Upstash's 500K/month free-tier command limit — and the month wasn't over. The write-to-read ratio was ~5:1, meaning the tracking endpoint was burning commands, not the dashboard reads. Profiling the pipeline revealed four culprits:
-
The Dashboard Read Path Got Too Smart:
- Problem: The dashboard was doing too much work per request. It scanned Redis keys, fetched large event buffers, rebuilt rollups, and fanned out into session metadata reads.
- Fix — Snapshot architecture: I introduced a dedicated snapshot builder that precomputes the expensive dashboard summary and stores it as a single Redis JSON blob. A cron job refreshes it every 6 hours, and the analytics route overlays the live recent event log on top.
- Impact:
- Typical dashboard loads now prefer one snapshot read instead of many structural scans.
- Recent-event payload dropped from 10,000 to 2,500 entries.
- Per-session read amplification was reduced to zero on the dashboard path.
Step-by-Step Implementation Guide
If you're looking to build something similar, here's how to structure the core components of the "Buffer & Flush" analytics engine.
Step 1: Client-side Event Buffering
Most tracking scripts send an HTTP request immediately for every click or scroll. This is expensive and slow. Instead, use a memory buffer in your _app.js or a custom React Hook.
let eventBuffer = [];
let flushTimeout = null;

function trackEvent(pathname, data = {}) {
  eventBuffer.push({ pathname, timestamp: new Date().toISOString(), ...data });

  // Flush immediately for pageviews, buffer others for 10s
  if (data.type === 'pageview') {
    flushEvents();
  } else if (!flushTimeout) {
    flushTimeout = setTimeout(flushEvents, 10000);
  }
}

function flushEvents() {
  if (eventBuffer.length === 0) return;
  const payload = JSON.stringify(eventBuffer);
  eventBuffer = []; // Clear buffer BEFORE sending to prevent duplicates

  // Use sendBeacon for more reliability on page exit
  if (navigator.sendBeacon) {
    navigator.sendBeacon('/api/track', new Blob([payload], { type: 'application/json' }));
  } else {
    fetch('/api/track', { method: 'POST', body: payload, keepalive: true });
  }
}
Step 2: Server-side Command Aggregation
On the server, your /api/track endpoint shouldn't just dump events into a database. It should aggregate them first. If one user clicks three links in a 10-second window, you should send one command to Redis, not three.
// pages/api/track.js
const sessionCache = new Map(); // Simple in-memory cache for warm Lambdas

export default async function handler(req, res) {
  const events = Array.isArray(req.body) ? req.body : [req.body];
  const pipe = redis.pipeline();

  // Use a map to aggregate counters locally before pipelining
  const localPageCounters = {};

  for (const event of events) {
    const { pathname, sessionId } = event;
    const isNewSession = !sessionCache.has(sessionId);

    if (isNewSession) {
      sessionCache.set(sessionId, true);
      pipe.set(`sessions:${sessionId}`, 'active', { nx: true, ex: 86400 });
    }

    localPageCounters[pathname] = (localPageCounters[pathname] || 0) + 1;
  }

  // Push all aggregated increments into the pipeline in one go
  Object.entries(localPageCounters).forEach(([path, count]) => {
    pipe.hincrby('visits:pages', path, count);
  });

  await pipe.exec();
}
Step 3: Fast Rollups with Redis
To keep the dashboard fast, I use Redis Daily Hashes for geo and referrer data. Instead of counting raw logs every time the dashboard loads, I "roll up" the data instantly during the write phase using HINCRBY.
Step 4: The Dashboard Read Model
The dashboard used to assemble too much of its state on demand. It now works in two layers:
- a snapshot layer for heavy summary metrics
- a recent overlay for live event inspection and lightweight filtering
That means the expensive work happens occasionally, and the interactive work stays cheap.
// cheap dashboard read path
const pipe = redis.pipeline()
pipe.get('visits:dashboard_snapshot:v1')
pipe.lrange('visits:events', 0, 2499)
const [snapshotRaw, recentRaw] = await pipe.exec()
And when the snapshot is missing, the system can still rebuild it safely:
if (!snapshot) {
  snapshot = await buildAnalyticsSnapshot(redis)
  await redis.set('visits:dashboard_snapshot:v1', JSON.stringify(snapshot), {
    ex: 60 * 60 * 24 * 7,
  })
}
Dashboard Metrics
The dashboard provides a breakdown of traffic across several dimensions:
- Geography: countries, cities, and a readable global footprint
- Source: classified referrers such as direct, search, social, and GitHub
- Behavior: time on page, reading depth, outbound clicks, and recent sessions
- Flow: a journey explorer that shows where people go after landing pages such as
/homeor/about - Platform: device, browser, and OS mix
Inspirations & Similar Approaches
This architecture drew inspiration from several established patterns in the web analytics community:
- Plausible Analytics: Their focus on simplicity and privacy over deep behavioral tracking served as a primary model for this project.
- Tinybird (Real-time Analytics): Their approach to using ingestion pipelines informed how I structured the Redis rollups.
- Redis "Fast Counter" Pattern: Using
HINCRBYfor atomic daily aggregates is a well-documented strategy for high-performance dashboards.
Privacy Considerations
IP addresses are hashed before storage, and the dashboard is intentionally private. I care about patterns, not personal identities. The goal is to learn from aggregate behavior without turning a personal site into a surveillance product.
Why I Like This Architecture
It has a nice balance:
- richer than a basic analytics snippet
- cheaper than a full warehouse
- more inspectable than a black-box SaaS dashboard
- private enough for a personal site
- flexible enough to keep evolving
The best part is that performance decisions are visible. When command usage gets too high, the fix is architectural, not just reactive.
References & Further Reading
- Redis HyperLogLog Documentation - Technical details on cardinality estimation.
- Upstash Redis Docs - Getting started with serverless Redis on Upstash.
- GDPR and IP Anonymization - Best practices for privacy-first tracking.
- Next.js Middleware - Exploring edge-side processing for lower latency.